Plots
This page describes the outputs from mandrake. Along with the plots, mandrake also outputs the embedding as:
mandrake.embedding.txtthe X-Y coordinates of the embedding as text.mandrake.names.txtthe sample names of each row in the embedding file.
Should you wish to create your own plots.
Interactive plot
An interactive plot of the embedding is written to mandrake.embedding.html,
which can be viewing in your web browser. This plot can be zoomed and panned,
and sample labels will appear when you hover over them. Use the controls in the
top-right to save your view as a static image. Double-click to zoom out.
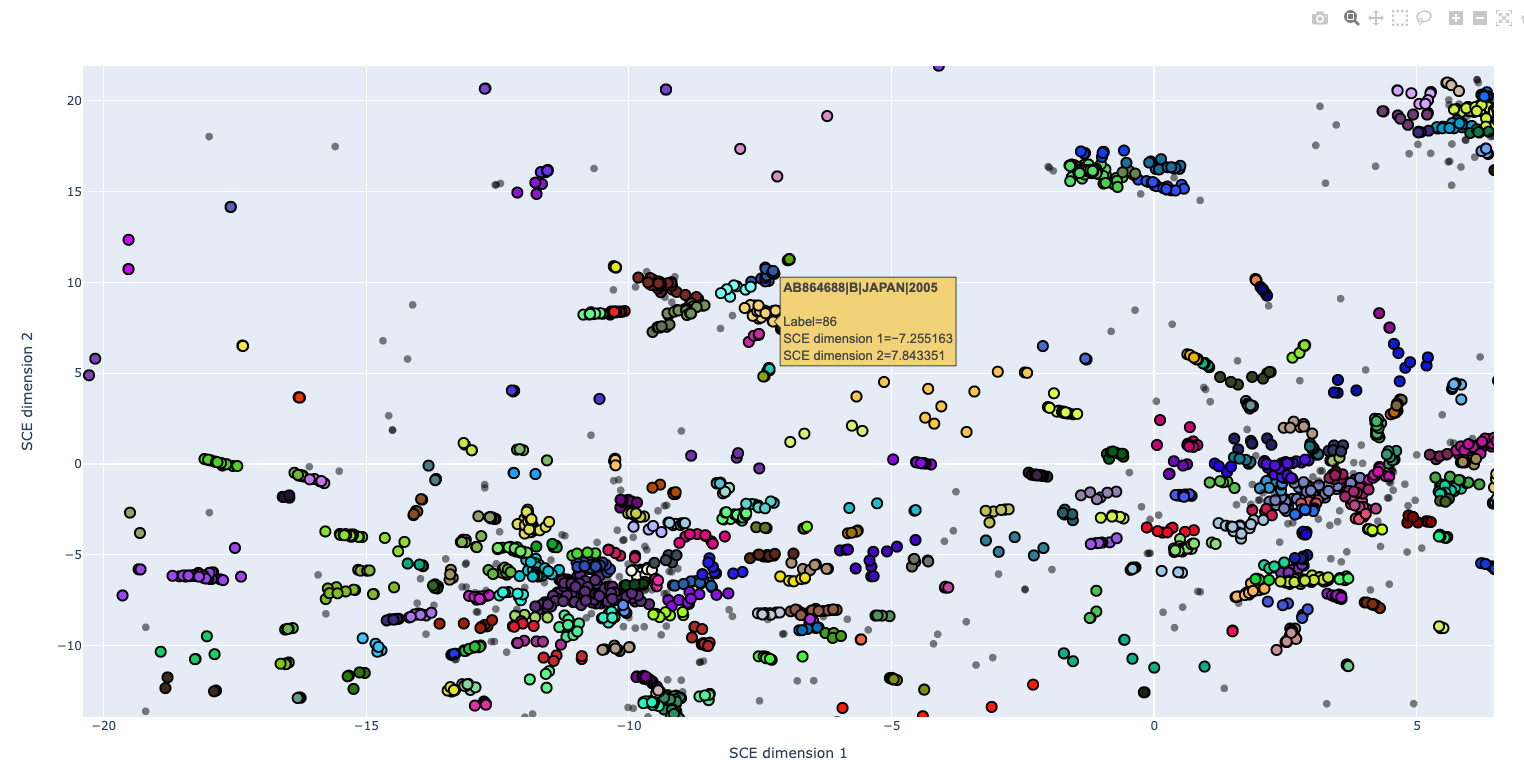
For large datasets this file may become very large due to the labels, in which case the static images might be preferred.
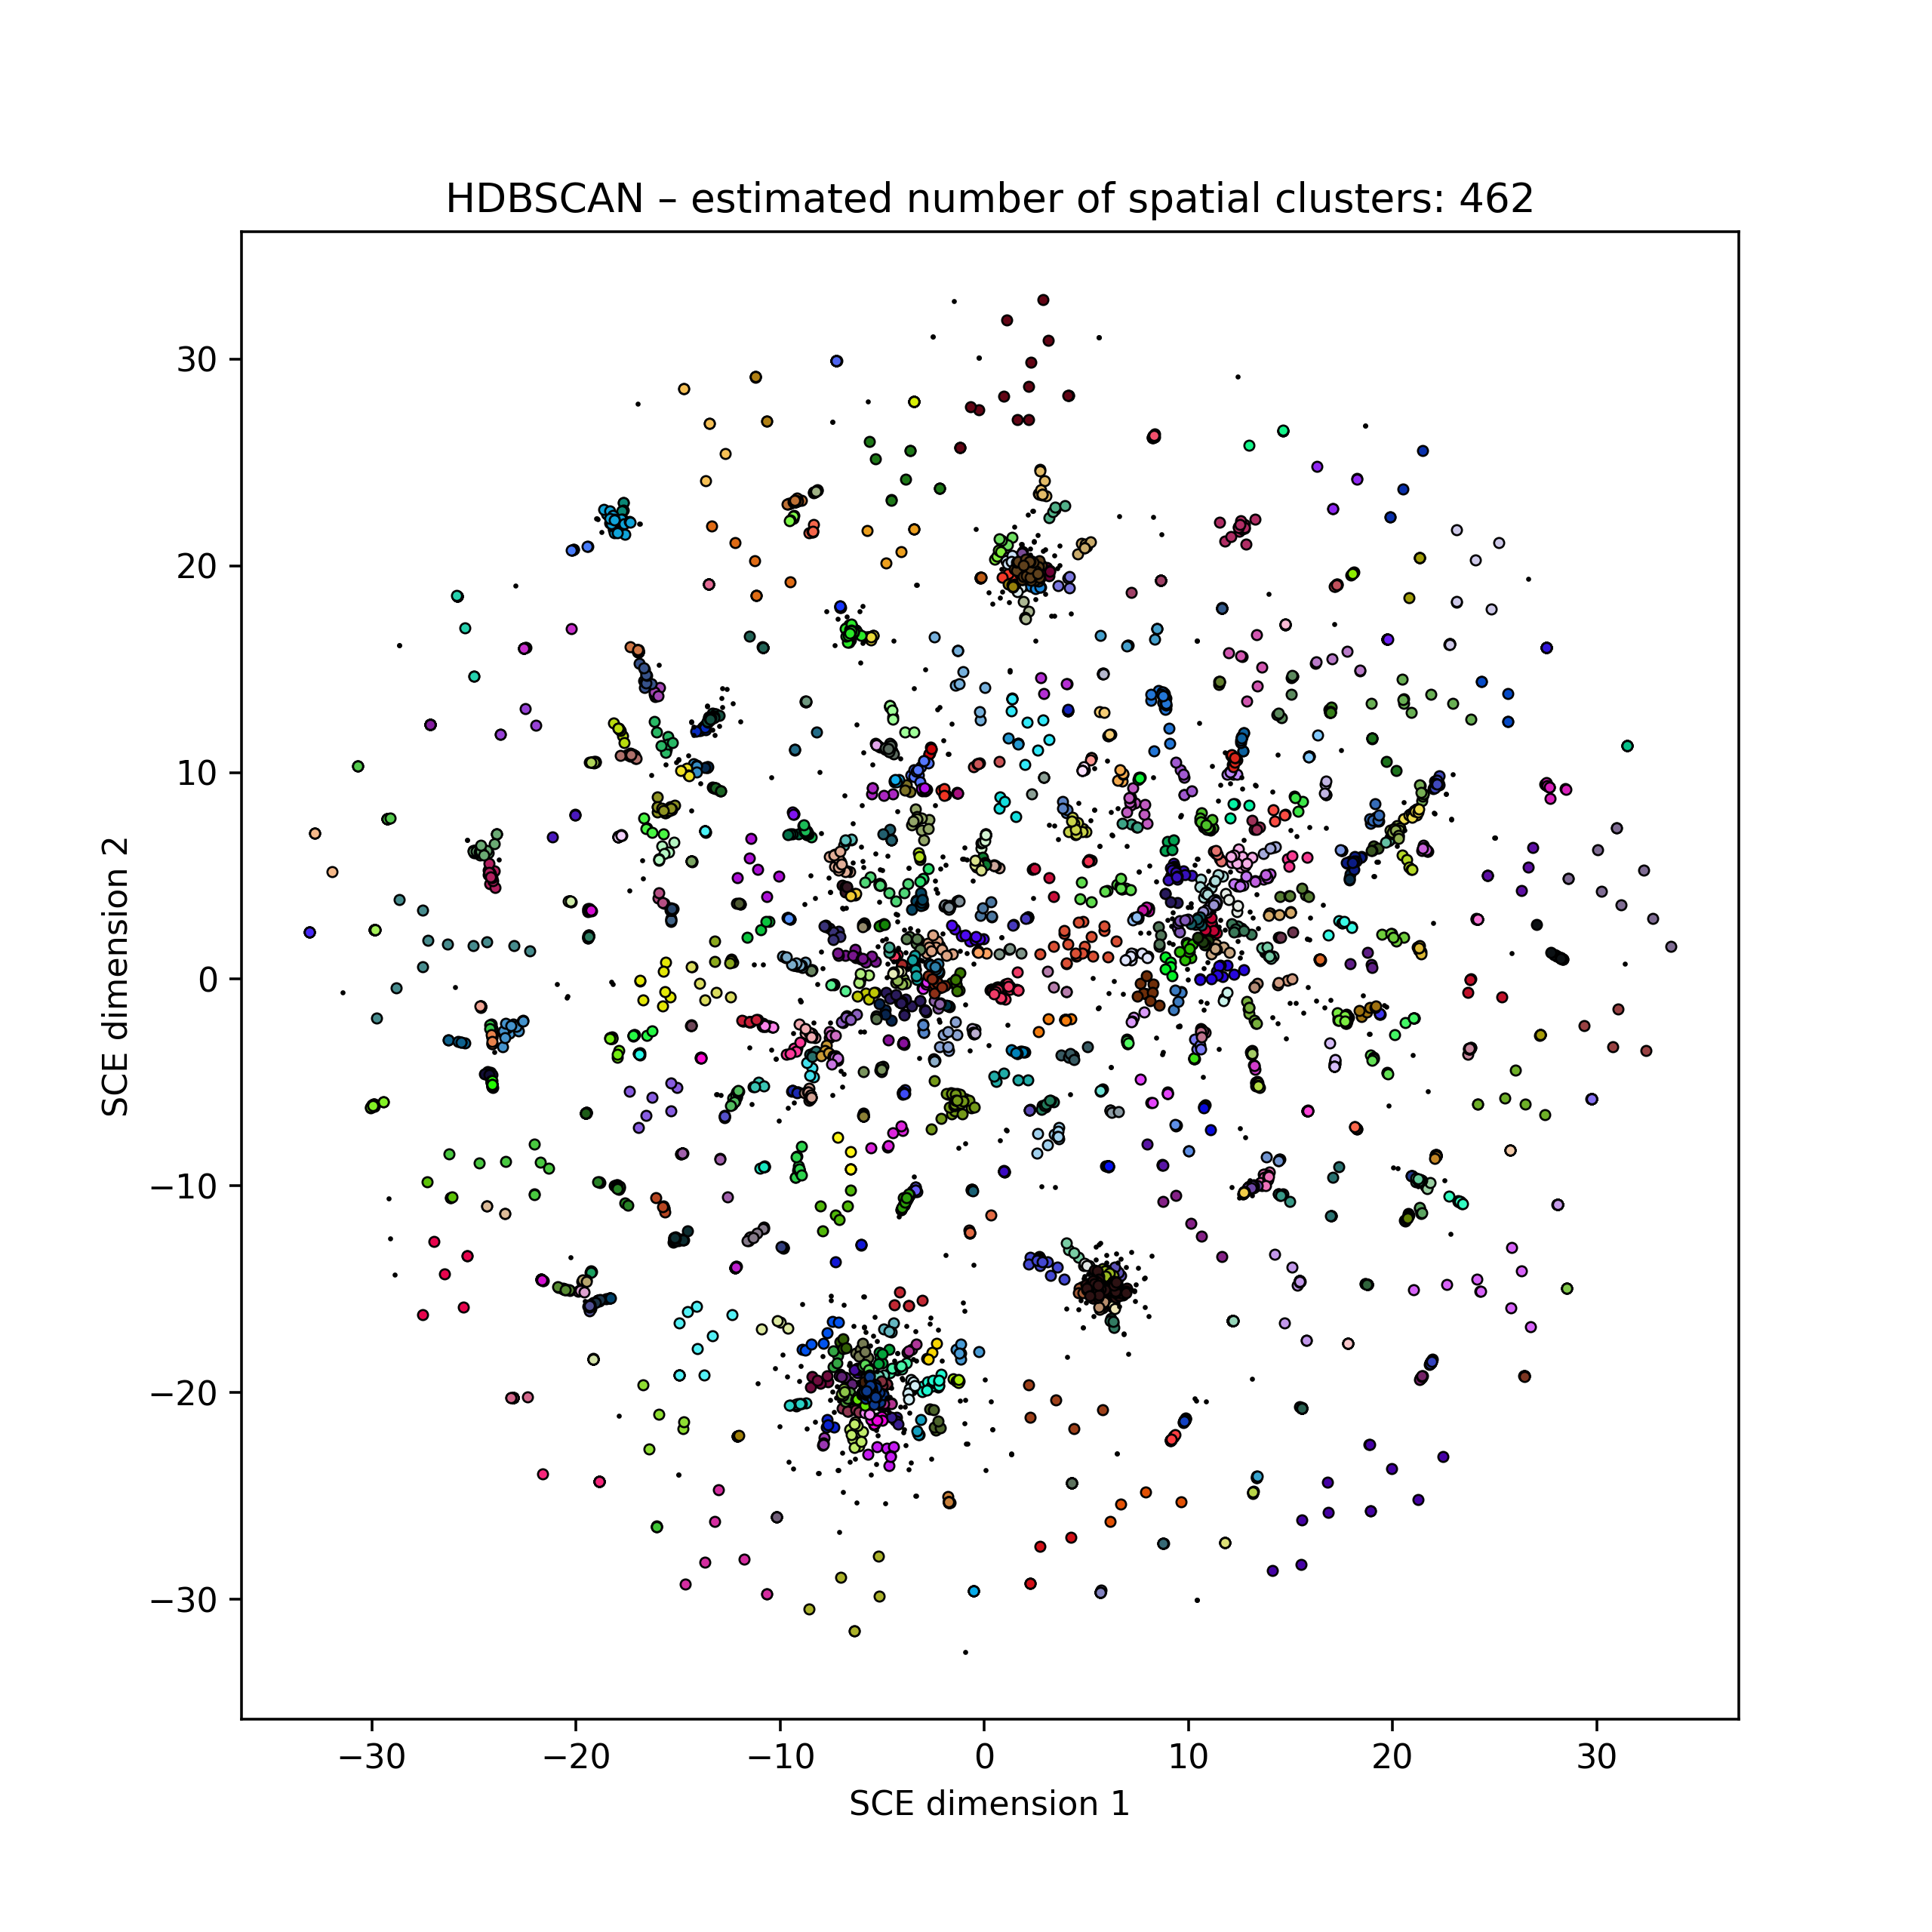
Static image
This is a non-interactive version of the embedding written to mandrake.embedding_static.png.
Point size will vary depending
on number of samples \(N\):
Small dataset, large points \(N < 1000\).
Medium dataset, medium points \(1000 < N < 10000\).
Large dataset, small points \(N > 10000\).
Points will be coloured by their labels if provided, or otherwise their HDBSCAN cluster (total number noted in the title). Colours are chosen at random, but consistently between runs:
Changing colours in the plots
The colours for each label are chosen at (pseudo)random, so while they will be
consistent between runs, they may also be fairly putrescent. To try a new
set of colours, give a different --seed. This should be an integer, and
setting --seed 1 will be the default colours.
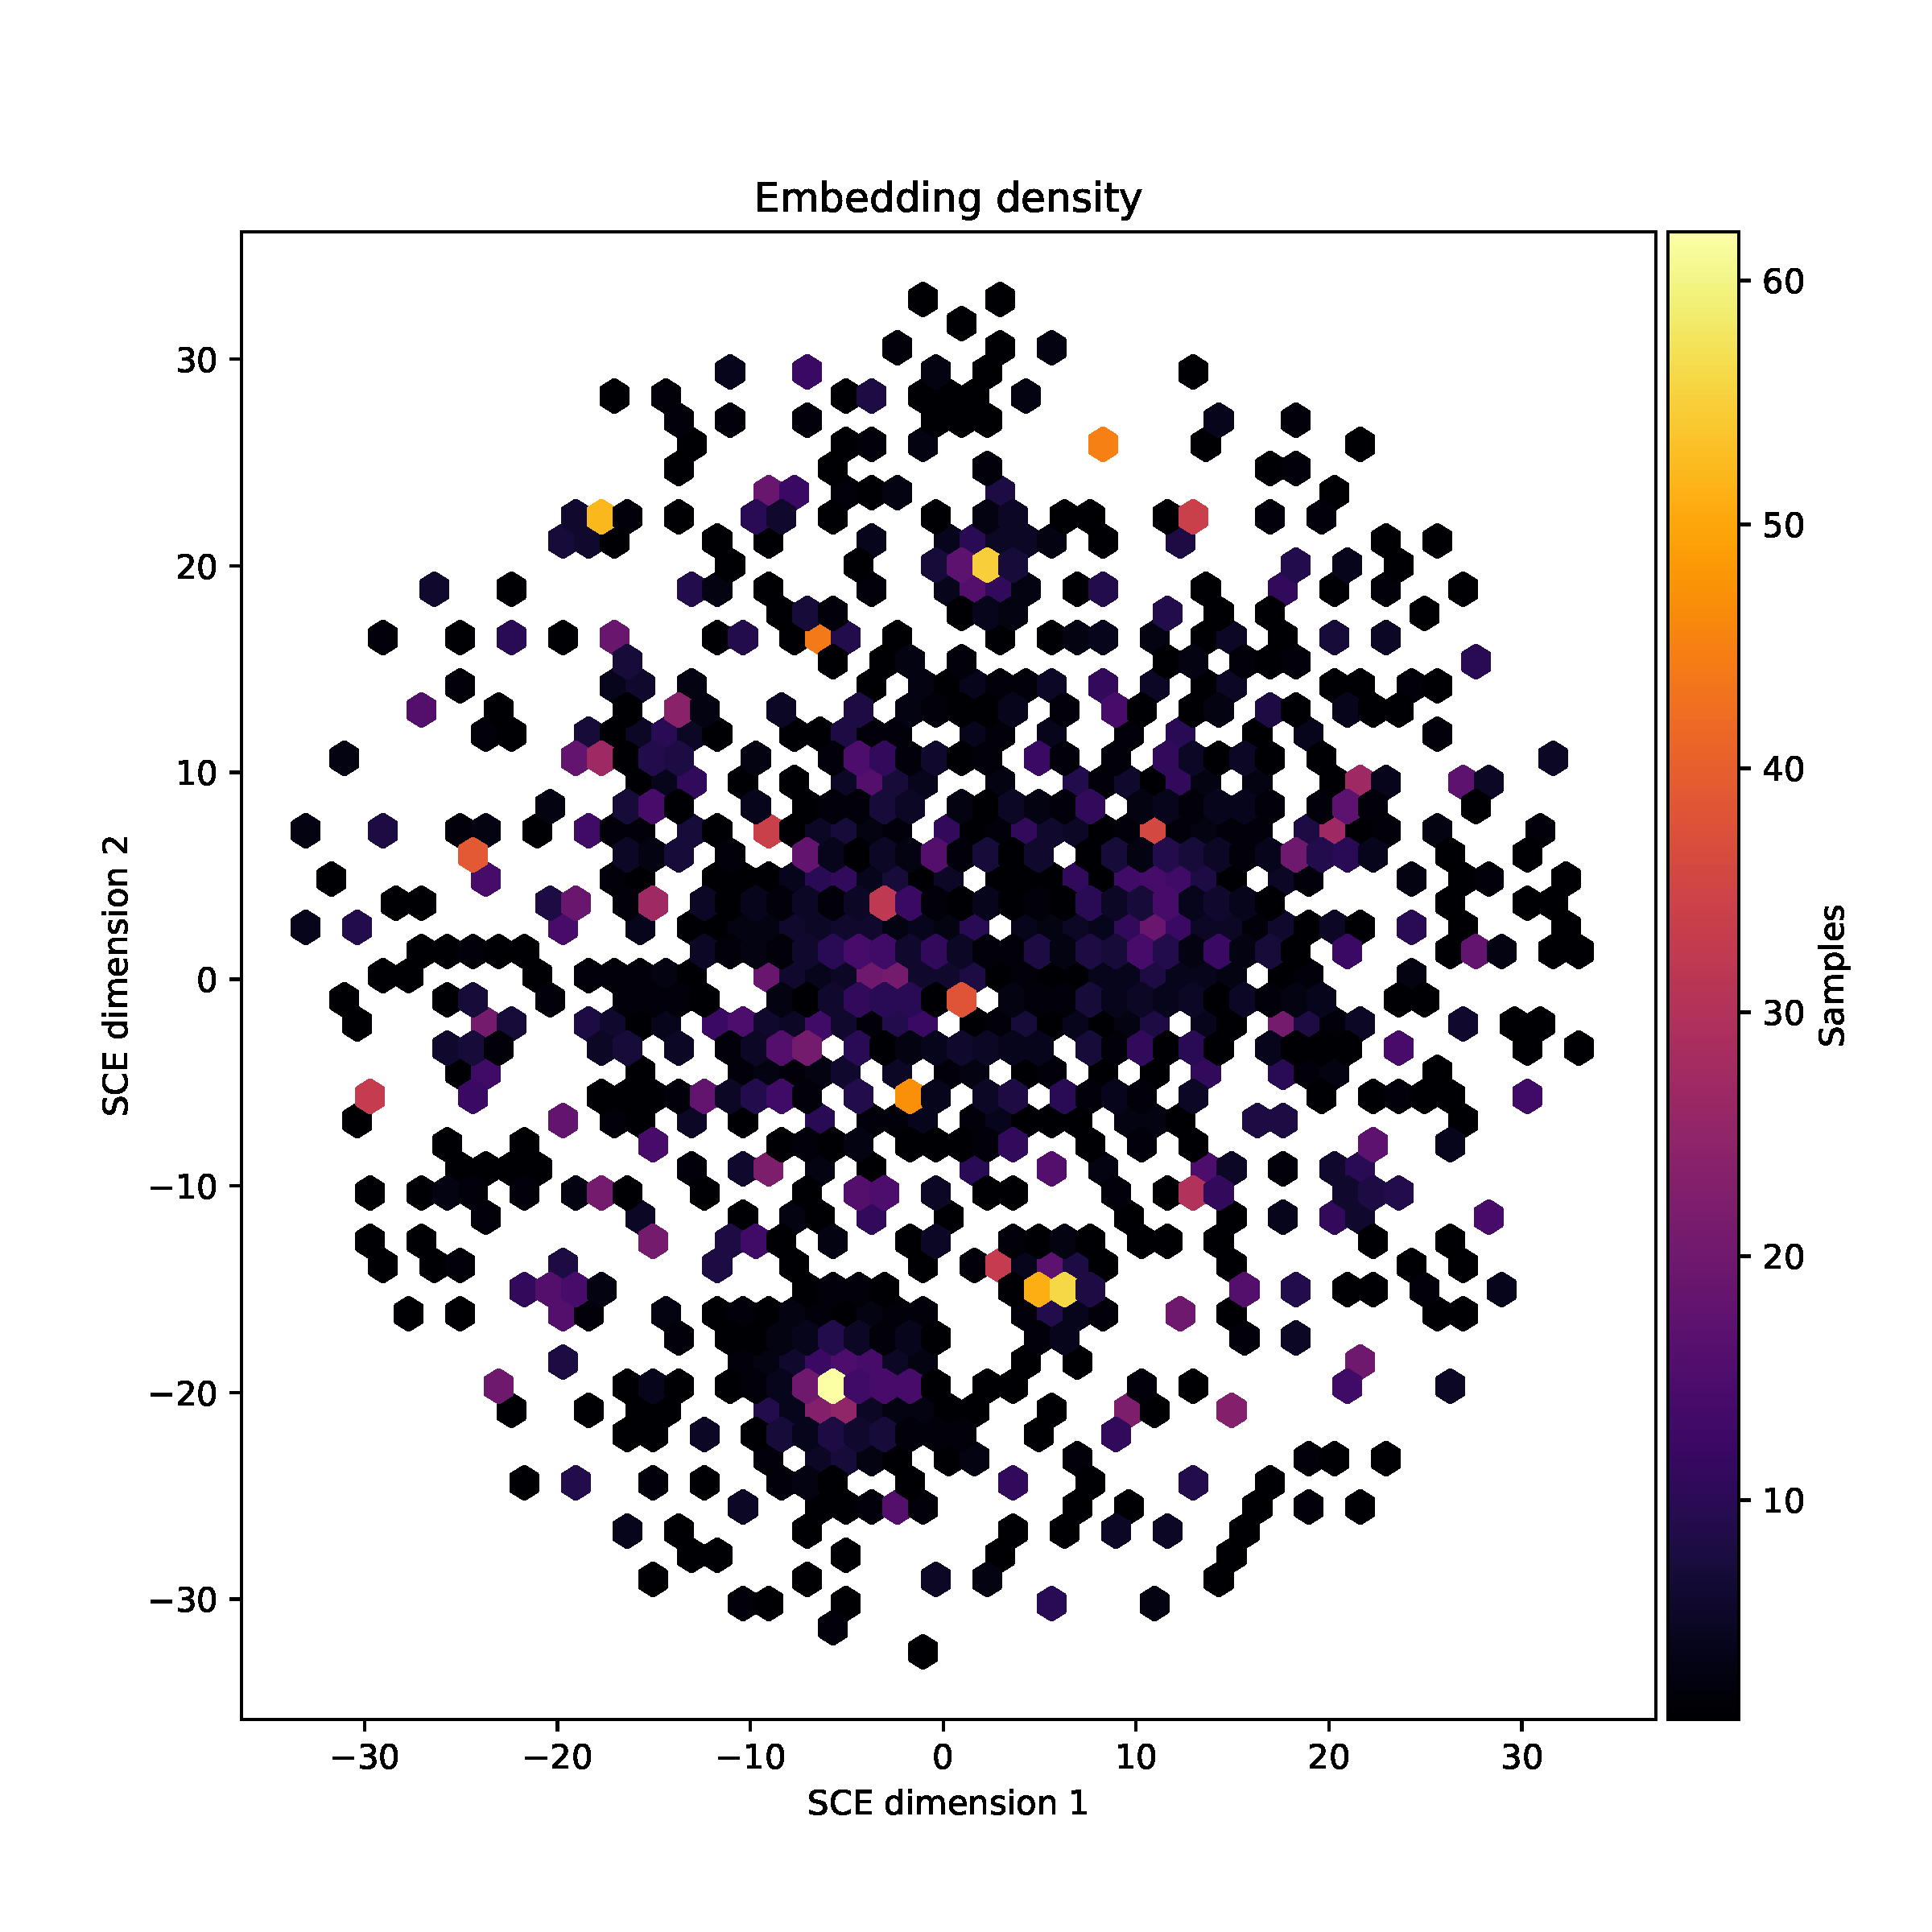
Density plot
Due to the nature of the SCE algorithm, many points are likely to be overploted.
This can be investiaged in the HTML plot by zooming in. For larger datasets, a useful
companion to the static image is the hexbin plot mandrake.embedding_density.pdf, which shows the number of points
in each region of the plot, divided into small tesselating hexagons:
Microreact output
You can also view your clusters in microreact, which will also let you combine the embedding visualisation with a tree, interactively.
Upload the mandrake.embedding.dot file. If you ran HDBSCAN clustering there
will also be mandrake.hdbscan_clusters.csv file you can include to colour the
points with.
If you used your own --labels, these can be used, as long as they
are formatted as a Microreact-compliant .csv file:
comma separated
with a header
sample names have column header ‘id’
append __autocolour to column headers you wish to colour points by